Device Monitor
Monitor > Device
The Device page displays the device statistics within the specified period, including the total traffic, CPU/memory utilization, new/concurrent sessions, SNAT, disk space utilization, and CPU/chassis temperature.
Viewing Device Monitoring Results
To view the device monitoring results, you must first enable the monitor function for the device resources. By default, the monitor function for the CPU/memory utilization, new/concurrent sessions, disk space utilization, and CPU/chassis temperature are enabled permanently, and you need to enable the monitor function for interface traffic and SNAT. For detailed information of Monitor, see Warning Rule Configuration.
To view the device monitoring results, take the following steps:
- To view the overview of the device statistics, click the Overview tab. With the Overview tab active, you can view the following information:
- Total traffic: Displays the total traffic within the latest 1 day. Hover your mouse over the chart to view the traffic statistics at a specific point in time.
- Hardware status: Displays the real-time hardware status, including the CPU utilization, memory utilization, disk space utilization, fan status, CPU temperature, and chassis temperature.
- New session: Displays the new sessions within the latest 1 day. Hover your mouse over the chart to view the new sessions statistics at a specific point in time.
- Concurrent sessions: Displays the concurrent sessions within the latest 1day. Hover your mouse over the chart to view the concurrent sessions at a specific point in time.
- Interface: Displays the real-time interface status, IP and traffic information. Choose Table or Graph from the top-right corner in the Interface table to view the interface status. If selecting Graph, hover your mouse over the interface to view the detailed interface information.
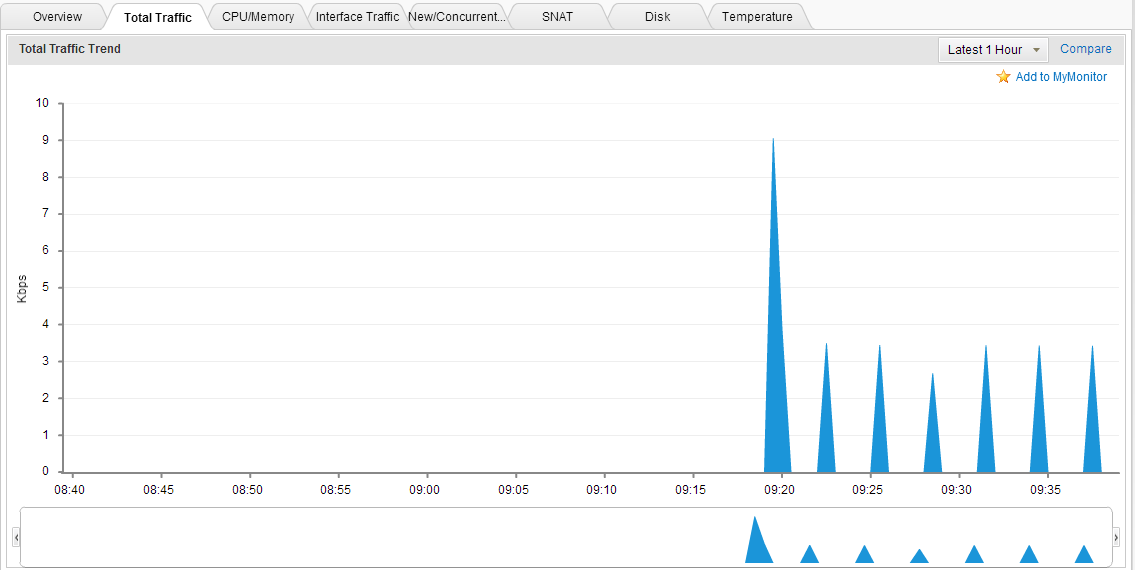
- To view the total traffic statistics, click the second Total Traffic tab next to the Overview tab or click the Details link in the Total Traffic table in the Overview tab. In the Total Traffic tab, the system displays the trend of the total traffic in the line chart. Hover your mouse on the line chart to view the traffic information at a specific point in time.
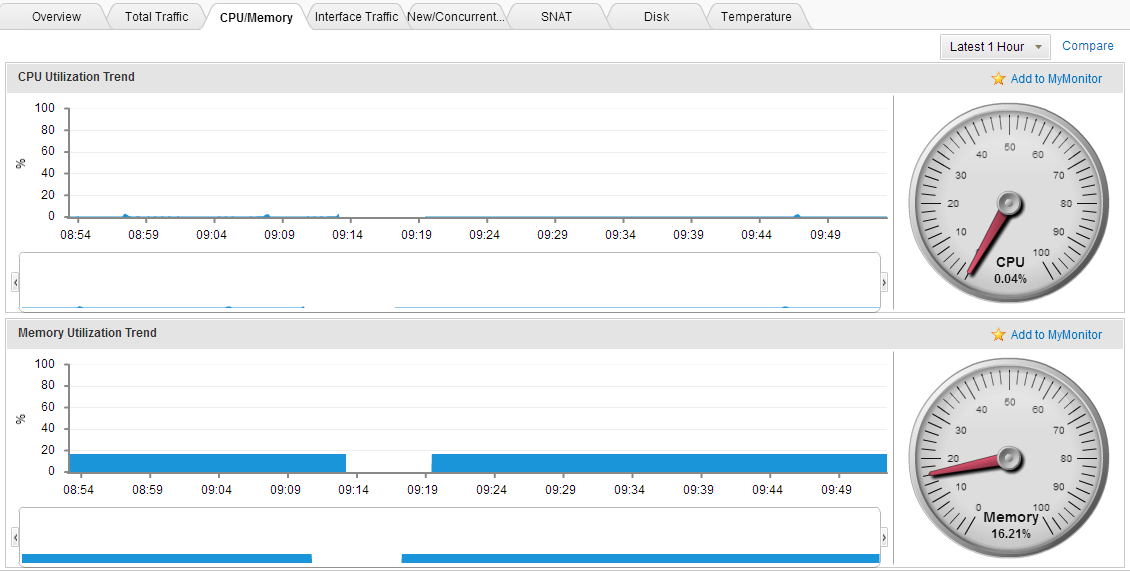
- To view the CPU/memory utilization statistics, click the third CPU/Memory tab or click the CPU Utilization link or the Memory Utilization link in the Hardware Status table in the Overview tab. In the CPU/Memory tab, the system displays the trend of the CPU utilization and memory utilization on the left side, and the real-time status of the CPU utilization and memory utilization on the right side. Hover your mouse over the line chart to view the CPU/memory utilization at a specific point in time.
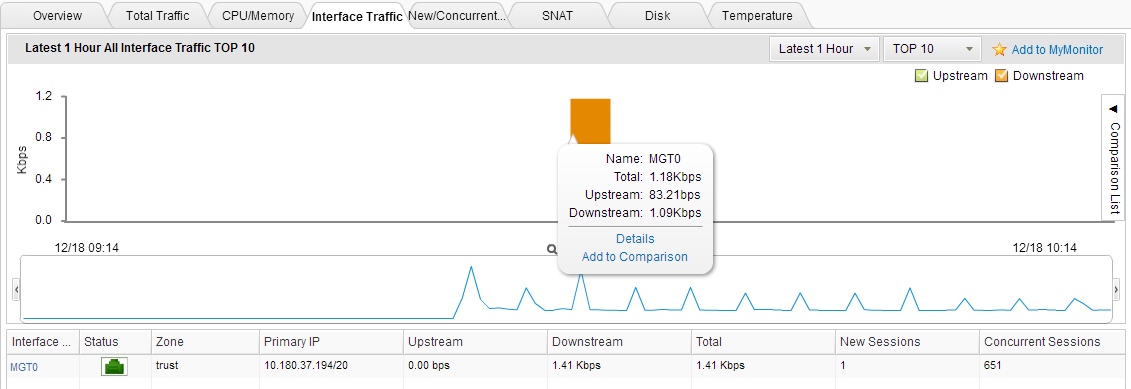
- To view the interface traffic statistics, click the fourth Interface Traffic tab or click the Details link in the Interface table in the Overview tab. In the Interface Traffic tab, the system displays the interface traffic information in the bar chart. Below the chart, a table displays the interface traffic information and other corresponding information. Hover your mouse over the bar of a certain interface to view the interface traffic information.
In the Interface Traffic tab, you can also perform the following actions:
- The TOP 10 drop-down menu is used to specify the numbers of interfaces to be displayed.
- The Upstream and Downstream checkboxes are used to specify the statistical objects to be displayed in the bar chart.
- When hovering over your mouse on a bar of an interface, select Details in the pop-up window to view the detailed information in a newly appeared page. Or you can click the interface name in the Interface Name column in the table to view the detailed information in a newly appeared page. For detailed information about the newly appeared page, see Viewing Detailed Information.
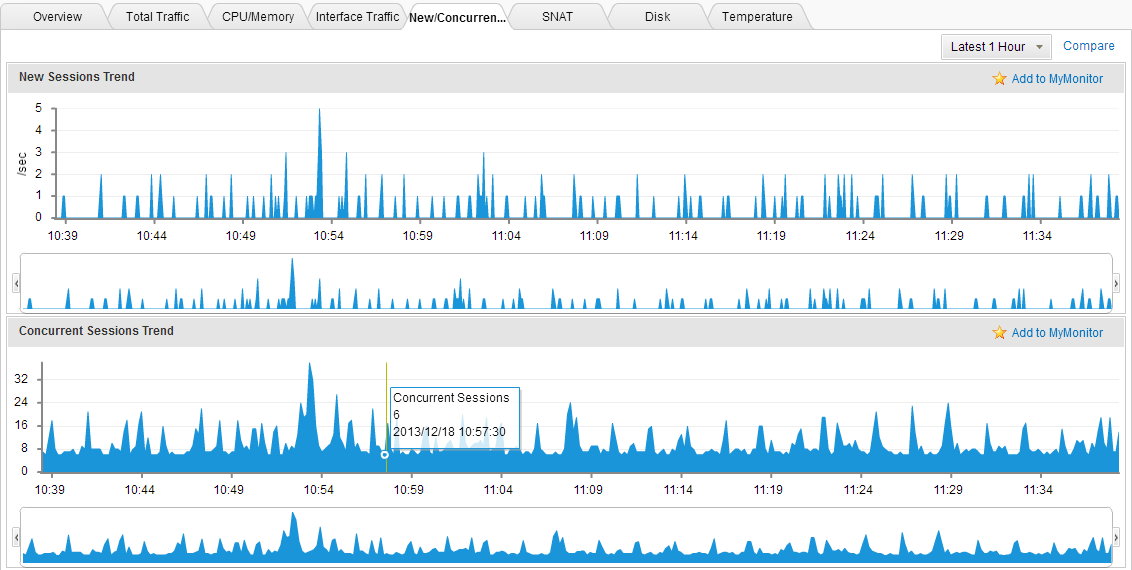
- To view the new/concurrent sessions statistical information, click the fifth New/Concurrent Sessions tab or click the Details link in the New Sessions or Concurrent Sessions table in the Overview tab. In the New/Concurrent Sessions tab, the system displays the trend of the new sessions and the concurrent sessions in the line chart. Hover your mouse over the line chart to view the new/concurrent sessions at a specific point in time.
- To view the SNAT statistical information, click the sixth SNAT tab. In the SNAT tab, the line chart displays the trend of SNAT ports use status. Below the chart, a table displays the detailed SNAT information. Hover your mouse over the line chart to view the SNAT information at a specific point in time.
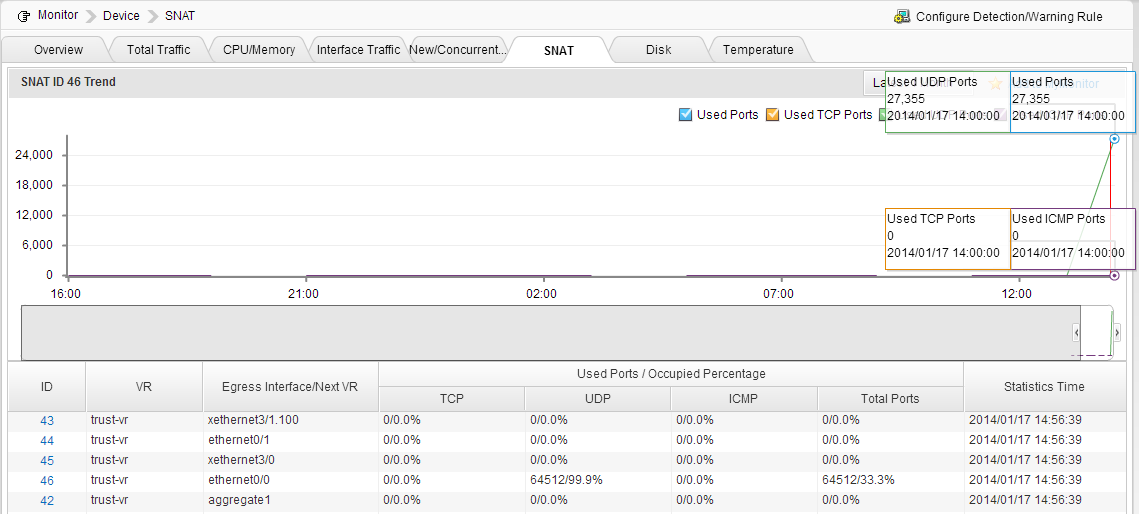
You can also perform the following actions in this tab:
- The Used Ports, Used TCP Ports, Used UDP Ports, and Used ICMP Ports checkboxes are used to specify the statistic objects to be displayed on the line chart.
- At the top-right corner of the table, enter the translated IP address in the Translated Address text box and then click Search to search all SNAT information of the translated IP address.
- In the Column drop-down menu, specify the columns to be displayed in the table.
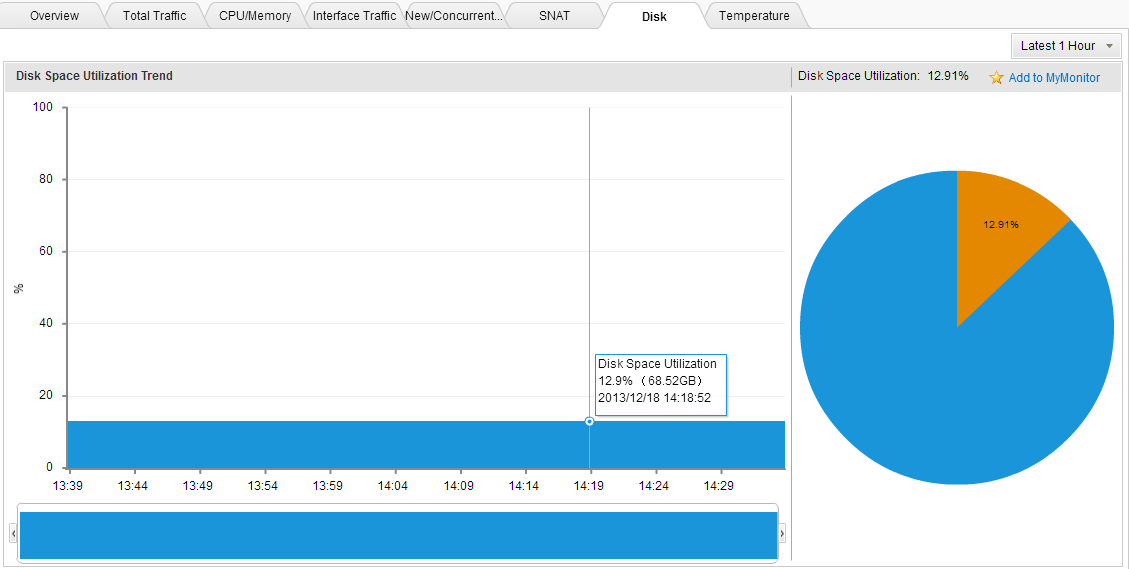
- To view the disk space utilization, click the seventh Disk tab or the Disk Space Utilization link in the Hardware Status table in the Overview tab. In the Disk tab, the line chart displays the trend of disk space utilization on the left side, and the pie chart displays the real-time disk space utilization on the right side. Hover your mouse over the line chart to view the disk space utilization at a specific point in time.
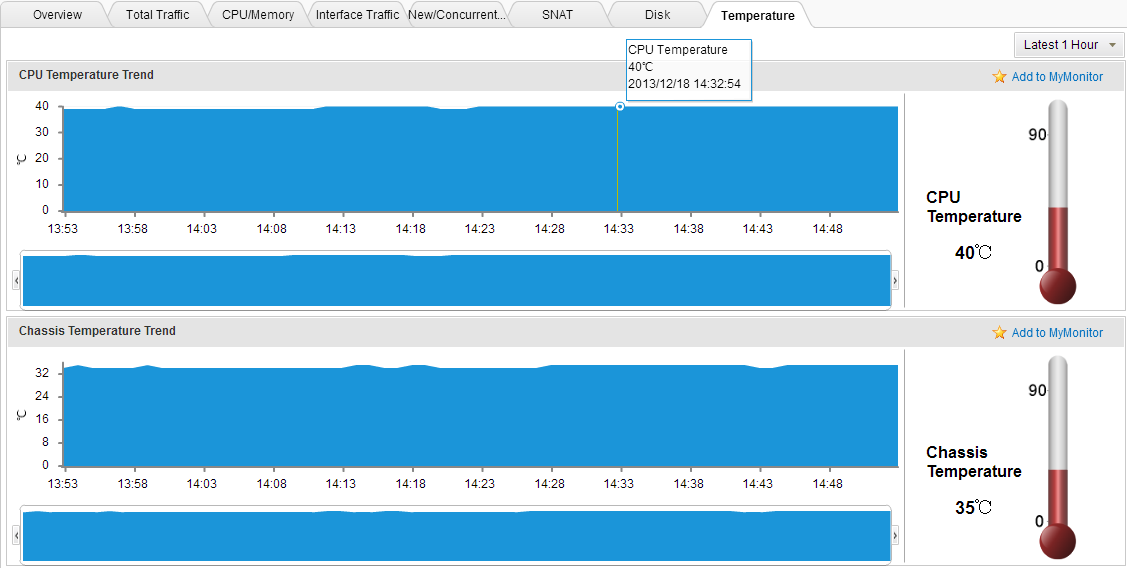
- To view the CPU/Chassis temperature statistical information, click the last Temperature tab or click the CPU Temperature or Chassis Temperature links in the Hardware Status table in the Overview tab. In the Temperature tab, the charts display the CPU/chassis temperature trend on the left side, and display the real-time CPU/chassis temperature on the right side. Hover your mouse over the left chart to view the CPU/chassis temperature at a specific point in time.
Tips: In most pages in Monitor, you can perform the following actions:
- Select different statistical period to view the statistical information in different period of time.
- Click the Add to Comparison link to compare the trend of different statistical objects in the pop-up window.
- Click the Add to MyMonitor link to save the chart information in the current page to MyMonitor, which facilitates the quick viewing of these charts.
- Drag both ends of the timeline, that is under the trend chart, area chart, and stacked chart, to the desired start time and end time, then you can drag the selected area to move it horizontally . The system will automatically display the statistical data within the selected period. Drag both ends of the timeline, that is under the bar chart and pie chart, to the desired start time and end time, then you can drag the selected area to move it horizontally to the desired location. Click Search to display the statistical data in the chart within the selected period.

Statistical Period
The system supports the predefined time cycle and the custom time cycle. Click Latest 1 Hour ( )on the top right corner of each tab to set the time cycle.
- Latest 1 Hour: Displays the statistical information within the latest 1 hour.
- Latest 1 Day: Displays the statistical information within the latest 1 day.
- Latest 1 Week: Displays the statistical information within the latest 1 week.
- Latest 1 Month: Displays the statistical information within the latest 1 month.
- Customize: Customize the time cycle. Select Customize. The Select Time dialog appears. Select the start time and the end time according to your requirements.
Viewing Detailed Information
Hover your mouse over the bar chart or the pie chart of certain monitored objects and then select Details from the pop-up menu. Then the detailed information appears in a new page for your viewing. In addition, in the detailed information page, hover your mouse over the bar or pie that represents a certain object to view the statistics of history trend and other information.
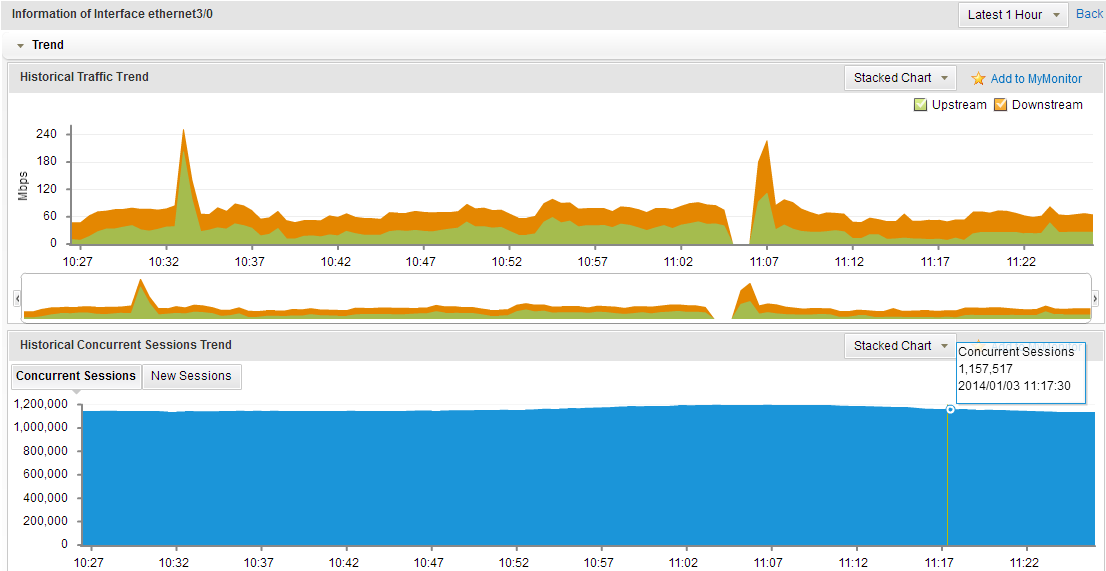
For example, in the Interface Traffic tab, hover your mouse over the bar of ethernet3/0 and then select Details in the pop-up menu. The detailed information of ethernet3/0 appears. The line chart and the stacked chart display the statistics of the history trend of concurrent sessions, new sessions, and ethernet0/0 traffic; the pie chart and the bar chart display the statistical information of user traffic, user concurrent sessions, user new sessions, application traffic, application concurrent sessions, and application new sessions. Click the Back button to return to the Interface Traffic tab.
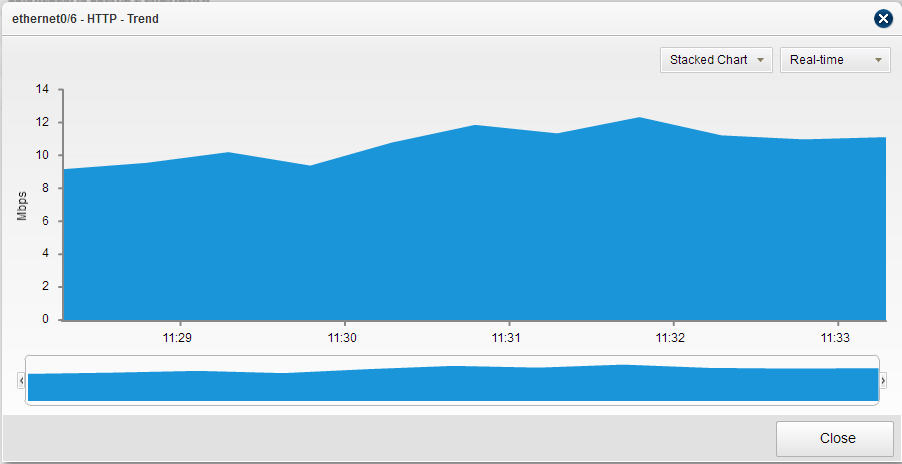
In the Application section, hover your mouse over the HTTP bar and click Trends in the pop-up menu. The <ethernet3/0-HTTP-Trend>page appears to display the trend of the HTTP traffic of interface ethernet3/0.
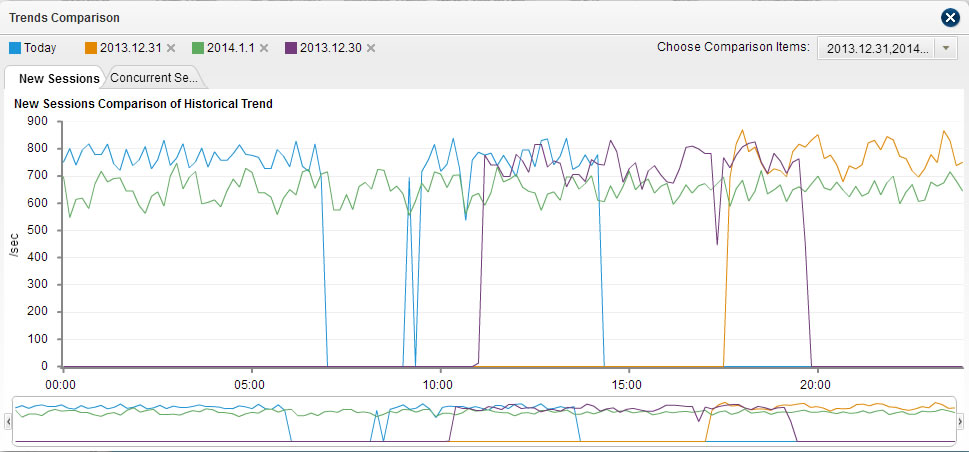
Trends Comparison
At the top-right corner of most pages in Monitor, you can click the Compare link to compare the trends of different statistical objects in the Trends Comparison window. For example, to compare the history trend of new sessions, take the following steps:
- With the New/Concurrent Sessions tab active, click Compare at the top-right corner. The Trends Comparison window appears.
- Choose the comparison items from the Choose Comparison Items drop-down list. The system will use legends with different colors to distinguish them from each other as shown below:
- To delete the selected monitored object, click the
 icon next to the comparison item.
In addition, hover your mouse over the monitor results in the bar chart and click the Add to Comparison link. The statistical object will be added to the comparison list. In the Comparison List, click Compare to compare the trends of different statistical objects in the Trends Comparison window. For example, to compare the interface traffic, take the following steps:
- With the Interface Traffic tab active, hover your mouse over the bar that represents an interface and click Add to Comparison in the pop-up menu. The interface is added to the Comparison List.
- Repeat to add more interfaces. To remove the added interfaces, click Delete in the Comparison List.
- In the Comparison List, click Compare. The Trends Comparison window appears. The system will use legends with different colors to distinguish them from each other.
- In order not to display the trend of certain monitored objects, uncheck the checkboxes next to the object names. To delete the selected monitored object from the comparison list, click the icon next to the comparison item.
Warning Rule Configuration
At the top-right corner of pages in Monitor, click the Warning Rule Configuration button (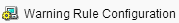 ). The Warning Rule Configuration dialog appears. In the dialog, you can perform the following actions:
- Configure the monitor settings for the device resources. After configuring settings, the system will monitor the device resources and take samples according to the configured intervals. By default, the system has permanently enabled the monitoring for CPU/memory, new/concurrent sessions, disk space utilization, CPU/chassis temperature.
- Configure the warning rules for the device resources. With warning rules configured, when events that match the warning rules happen, the system can monitor the events and generate the warning information. For details about configuring warning rules, see Warnning Rule Configuration.
Options in the Warning Rule Configuration dialog:
| Option |
Description |
|
CPU/Memory
|
- CPU Detect Interval: Specify the CPU detect interval. The range is from 5s to 30s. The default value is 10s. Click Restore Default to restore the value to the default one.
- Memory Detect Interval: Specify the memory detect interval. The range is from 30s to 300s. The default value is 60s. Click Restore Default to restore the value to the default one.
|
|
Interface Traffic
|
Click Detect Rule Configuration. In this tab, configure the detect rule settings:
- New: Click this button. In the pop-up Interface Configuration-New dialog, configure the detect rule. From the Interface drop-down list, select the interface that you want to enable the monitor function. In the Detect Interval text box, enter the detect interval. The range is from 5s to 30s. The default value is 10s. In the Upstream Bandwidth text box, enter the maximum upstream bandwidth. The range is from 1Kbps to 10,000,000Kbps. The default value is 1,000,000Kbps. In the Downstream Bandwidth text box, enter the maximum downstream bandwidth. The range is from 1Kbps to 10,000,000Kbps. The default value is 1,000,000Kbps. Click Restore Default to restore the value to the default one.
- Edit: Select a detect rule from the rule table and then click Edit to edit the selected rule.
- Delete: Select detect rules from the rule table and then click Delete to delete the selected rules.
- Enable: Select detect rules from the rule table and then click Enable to enable the selected detect rules.
- Disable: Select detect rules from the rule table and then click Disable to disable the detect rules.
- Search: Enter the key words of the interface name in the text box and then click Search to search the detect rules whose interface name contains the key words.
|
|
New/Concurrent Sessions
|
- New Sessions Detect Interval: Specify the new sessions detect interval. The range is from 1s to 10s. The default value is 5s. Click Restore Default to restore the value to the default one.
- Concurrent Sessions Detect Interval: Specify the concurrent sessions detect interval. The range is from 1s to 10s. The default value is 5s. Click Restore Default to restore the value to the default one.
|
|
SNAT
|
Click the Detect Rule Configuration tab and configure the detect rules:
- New: Click this button. In the pop-up SNAT Configuration-New dialog, configure the detect rule. From the VR drop-down list, select the virtual router that the SNAT belongs to. In the Detect Interval text box, enter the detect interval. The range is from 30s to 180s. The default value is 60s. In the SNAT ID text box, enter the SNAT ID for which you want to enable the monitor function. The range is from 1 to 4096. Click Restore Default to restore the value of Detect Interval to the default one.
- Edit: Select a detect rule from the rule table and click Edit to edit the selected rule.
- Delete: Select detect rules from the rule table and click Delete to delete the selected rules.
- Enable: Select detect rules from the rule table and click Enable to enable the selected detect rules.
- Disable: Select detect rules from the rule table and click Disable to disable the selected detect rules.
- Search: Enter the translated address in the text box and then click Search to search the detect rules whose translated address contains the entered words.
|
|
Disk
|
Disk Detect Interval: Specify the disk detect interval. The range is from 1 minute to 15 minutes. The default value is 5 minutes. Click Restore Default to restore the value to the default one.
|
|
Temperature
|
Temperature Detect Interval: Specify the CPU/chassis temperature detect interval. The range is from 30s to 300s. The default value is 60s. Click Restore Default to restore the value to the default one.
|