Proactive Detection Report
Proactive Detection
According to different proactive detected items, there are three types of detection reports: service detection report, network detection report, and resource detection report. Each detected item has its own report and health status. Besides, the Overview page provides the report of the network health trend.
Network Health Trend
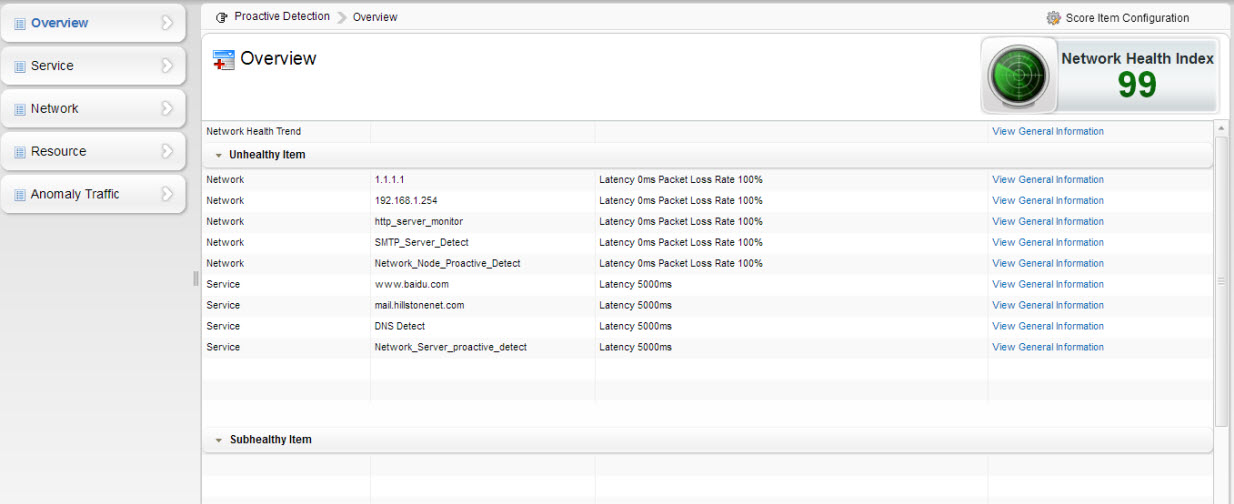
Proactive Detection > Overview
The Overview page provides the report of the network health trend and displays all detected items that are in the unhealthy and subhealth status.
In the Overview page, click the View General Information link at the top-right corner, the General Information tab appears as shown below. In this tab, you can perform the following actions:
- View the network health trend within the latest 1 hour/day/week/month or customized period of time.
- Select the desired items in the legends to display their trends within the specified period. The items in the legends contain All, Service, Network, Resources, and Anomaly Traffic.
- Hover your mouse over the legends of Service or Network, the system will display whether you have configured the service detected items or network detected items. If no detected items are configured, you can click Go to Configure to enter into the Monitor module and configure the items.
Service Detection Report
Proactive Detection > Service
The service detection page displays the health status and detection reports of all configured service detected items.
Options in the table:
| Option |
Description |
|
Detected Item
|
Displays the name of the service detected item.
|
|
Detective Type
|
Displays the detective type of the detected item such as HTTP, POP3, SMTP, FTP, and customized types. For detailed information on configurations, see Service/Network Node Monitor.
|
|
Latency
|
Displays the latency of the detected item.
|
|
Health Status
|
Displays the health status of the detected item, including Healthy ( ), Subhealthy ( ), Subhealthy ( ), and Unhealthy ( ), and Unhealthy ( ). ).
|
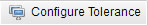
In the Service Detection page, click the View General Information link next to a detected item to view the general information of it as shown below. In this tab, you can perform the following actions:
- View the latency trend of the service within the latest 1 hour/day/week/month or customized period.
- Click
 to view the real-time latency and health status.
- Click
 to define the tolerance of the current detected item. Hold the left mouse button on the black triangle and drag the line to the desired position. The green area represents the tolerance of Healthy; the yellow area represents the tolerance of Subhealthy; the red area represents the tolerance of Unhealthy. If you select the Scored checkbox, this detected item will be considered when calculating the network health index. You can also configure the warning rules in the Tolerance Configuration dialog if desired. View Warning Rule Configuration for more detailed information.
- View the history trend and the time trend of the traffic that flows through the device and towards the service node.
- Click the Warning Rule Configuration link at the top-right corner of the Warning Information table to configure the warning rules for this service. For detailed information, view Warning Rule Configuration.
Network Detection Report
Proactive Detection > Network
The network detection page displays the health status and detection reports of all configured network detected items.
Options in the table:
| Option |
Description |
|
Detected Item
|
Displays the name of the network detected item.
|
|
Detective Type
|
Displays the detective type of the detected item. For detailed information, see Service/Network Node Monitor.
|
|
Packet Loss Rate
|
Displays the packet loss rate of the network node.
|
|
Latency
|
Display the latency of the network node.
|
|
Health Status
|
Displays the health status of the network detected item, including Healthy (), Subhealthy (), and Unhealthy ().
|
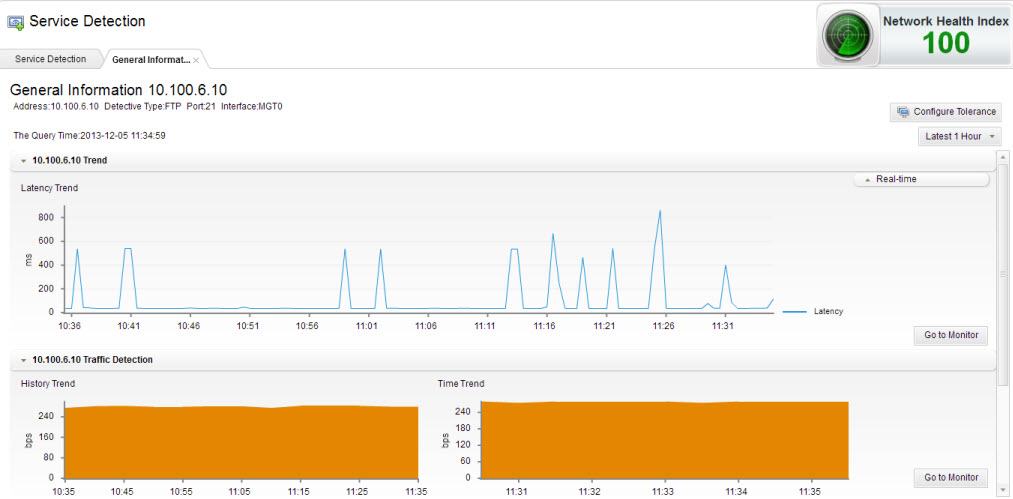
In the Network Detection page, click the View General Information link next to a detected item to view the general information of it as shown below. In this page, you can perform the following actions:
- View the latency trend and the packet loss rate of the device within the latest 1 hour/day/week/month or customized period.
- Click to view the real-time latency, packet loss rate and health status of the device.
- Click to define the tolerance of the current detected item. Hold the left mouse button on the black triangle and drag the line to the desired position. The green area represents the tolerance of Healthy; the yellow area represents the tolerance of Subhealthy; the red area represents the tolerance of Unhealthy. If you select the Scored checkbox, this detected item will be considered when calculating the network healthy index. You can also configure the warning rules in the Tolerance Configuration page if desired. View Warning Rule Configuration for more detailed information.
- View the history trend and the time trend of the traffic that flows through the device and towards the service node.
- Click the Warning Rule Configuration link at the top-right corner of the Warning Information table to configure the warning rules for this service. For detailed information, view Warning Rule Configuration.
Resource Detection Report
Proactive Detection > Resource
The resource detection page displays the health status and detection reports of all configured device resource detected items. The device resource includes CPU utilization, memory utilization, disk space utilization, new sessions, concurrent sessions, chassis temperature, interface traffic, and NAT resource.
Options in the table:
| Option |
Description |
|
Detected Item
|
Displays the name of the resource detected item.
|
|
Sample
|
Displays the real-time sample of the detected item
|
|
Health Status
|
Displays the health status of the network detected item, including Healthy (), Subhealthy (), and Unhealthy ().
|
In the Resource Detection page, click the View General Information link next to a detected item to view the general information of it as shown below. In this page, you can perform the following actions:
- View the trend of the detected item within the latest 1 hour/day/week/month or customized period.
- Click to view the sample and health status.
- Click to define the tolerance of the current detected item. Hold the left mouse button on the black triangle and drag the line to the desired position. The green area represents the tolerance of Healthy; the yellow area represents the tolerance of Subhealthy; the red area represents the tolerance of Unhealthy. If you select the Scored checkbox, this detected item will be considered when calculating the network health index. You can also configure the warning rules in the Tolerance Configuration page if desired. View Warning Rule Configuration for more detailed information.
- View other monitored information that relates to this detected item.
- Click the Warning Rule Configuration link at the top-right corner of the Warning Information table to configure the warning rules for this service. For detailed information, view Warning Rule Configuration.
Notes:
- If you have configured several interface traffic detected items, only the one with the worst health status will be displayed in the table. Click the View all interface link, the All interface tab appears to display all interface traffic detected items, their health status and their detection reports.
- If you have configured several SNAT resource detected items, only the one with the worst health status will be displayed in the table. Click the View all SNAT link, the All SNAT tab appears to display all SNAT resource detected items, their health status and their detection reports.