User Monitor
Monitor > User
The User page displays the user statistics within the specified period, including the user traffic, user concurrent sessions, and user new sessions.
Viewing User Monitoring Results
To view the user monitoring results, take the following steps:
- To view the user traffic statistics, click the User Traffic tab. This tab displays the user traffic ranking during specified period or of specified interfaces/zones. Hover your mouse over the certain bars to view the traffic information.
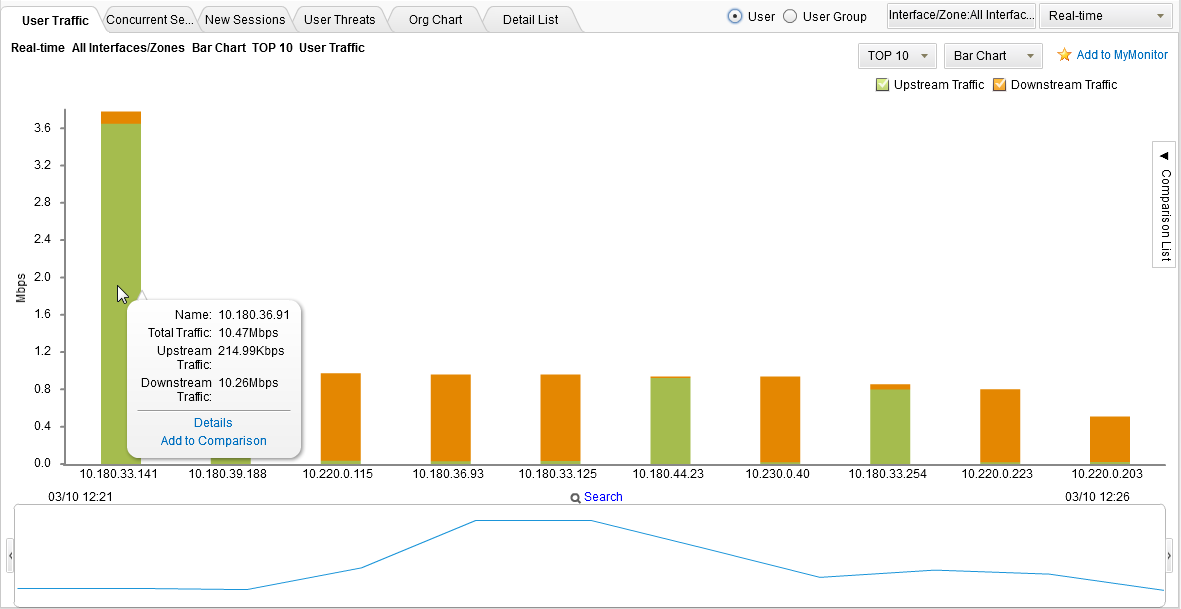
From the TOP10 drop-down menu, select the user numbers for ranking; from the Bar Chart drop-down menu, switch between the bar chart and the pie chart. The Upstream and Downstream legends are used to select the statistical objects in the bar chart.
- To view the user concurrent sessions statistics, click the Concurrent Sessions tab. This tab displays the user concurrent sessions ranking during the specified period or of the specified interfaces/zones. Hover your mouse over certain bars to view the user concurrent sessions information.
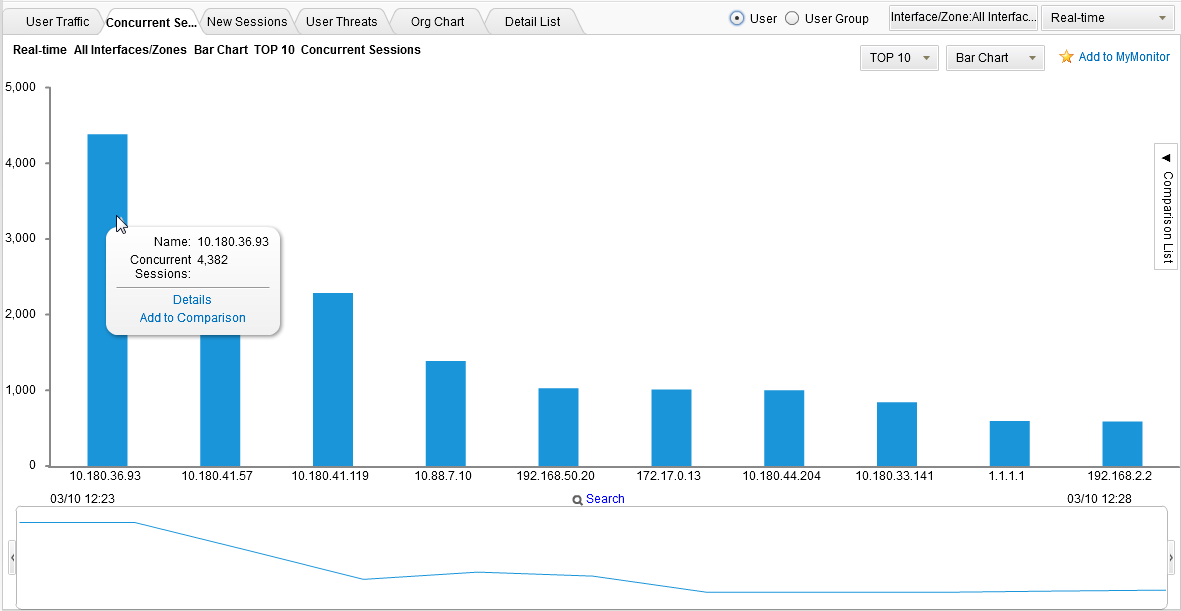
From the TOP10 drop-down menu, select the numbers of user concurrent sessions for ranking; from the Bar Chart drop-down menu, switch between the bar chart and the pie chart.
- To view the user new sessions statistics, click the New Sessions tab. This tab displays the user new sessions ranking during the specified period or of the specified interfaces/zones. Hover your mouse over certain bars to view the new sessions information.
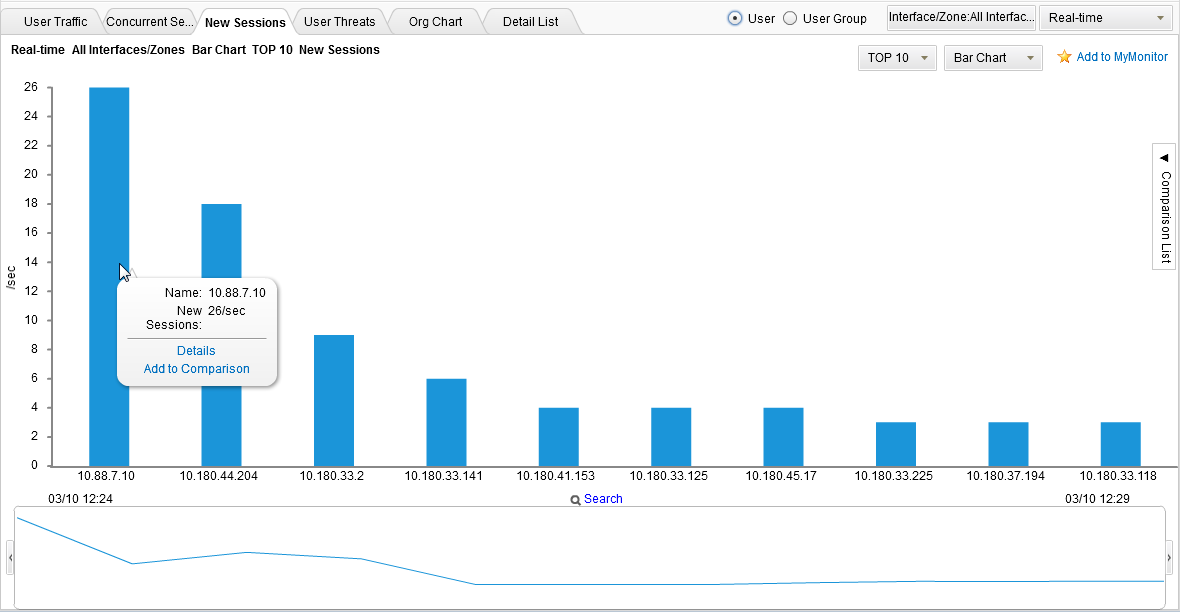
From the TOP10 drop-down menu, select the numbers of user new sessions for ranking; from the Bar Chart drop-down menu, switch between the bar chart and the pie chart.
- To view the overview of the user monitoring statistics, click the Detail List tab. This tab displays the user statistics during the specified period or of the specified interfaces/zones, inlcuding the total traffic, upstream, downstream, concurrent sessions and new sessions.
At the top-right corner of this page, you can search the desired users by entering the keyword of the username or IP address. To view the detailed information of a certain user, click the link in the Username/IP column, or click the Details link in the Details column to view the detailed statistics. For more information, see Viewing Detailed Information.
Tips: In most pages in Monitor, you can perform the following actions:
- Click the Interface/Zone: Total Interfaces/Zones button. In the Select Interface/Zone pop-up window, select the interfaces or zones that the users belong to. The system allows at most 6 interfaces or 3 zones. By default, all interfaces and zones are selected.
- Select different statistical period to view the statistical information in different period of time.
- Click the Add to MyMonitor link to save the chart information in the current page to MyMonitor, which facilitates the quick viewing of these charts.
- Hover your mouse over a bar or a pie and click the Details link. The detailed information appears in a new pop-up window. For more information, see Viewing Detailed Information.
- Hover your mouse over a bar or a pie and click the Add to Comparison link to add the statistical object to the Comparison List. In the Comparison List, click the Compare link to compare the trend of different statistical objects in the Trends Comparison window.
- Drag both ends of the timeline, that is under the trend chart, area chart, and stacked chart, to the desired start time and end time, then you can drag the selected area to move it horizontally . The system will automatically display the statistical data within the selected period. Drag both ends of the timeline, that is under the bar chart and pie chart, to the desired start time and end time, then you can drag the selected area to move it horizontally to the desired location. Click Search to display the statistical data in the chart within the selected period.

Statistical Period
The system supports the predefined time cycle and the custom time cycle. Click Latest 1 Hour ( ) on the top right corner of each tab to set the time cycle.
- Latest 1 Hour: Displays the statistical information within the latest 1 hour.
- Latest 1 Day: Displays the statistical information within the latest 1 day.
- Latest 1 Week: Displays the statistical information within the latest 1 week.
- Latest 1 Month: Displays the statistical information within the latest 1 month.
- Customize: Customize the time cycle. Select Customize. The Select Time dialog appears. Select the start time and the end time according to your requirements.
Viewing Detailed Information
Hover your mouse over the bar chart or the pie chart of certain monitored objects and then select Details from the pop-up menu. Then the detailed information appears in a new page for your viewing. In addition, in the detailed information page, hover your mouse over the bar or pie that represents a certain object to view the statistics of history trend and other information.
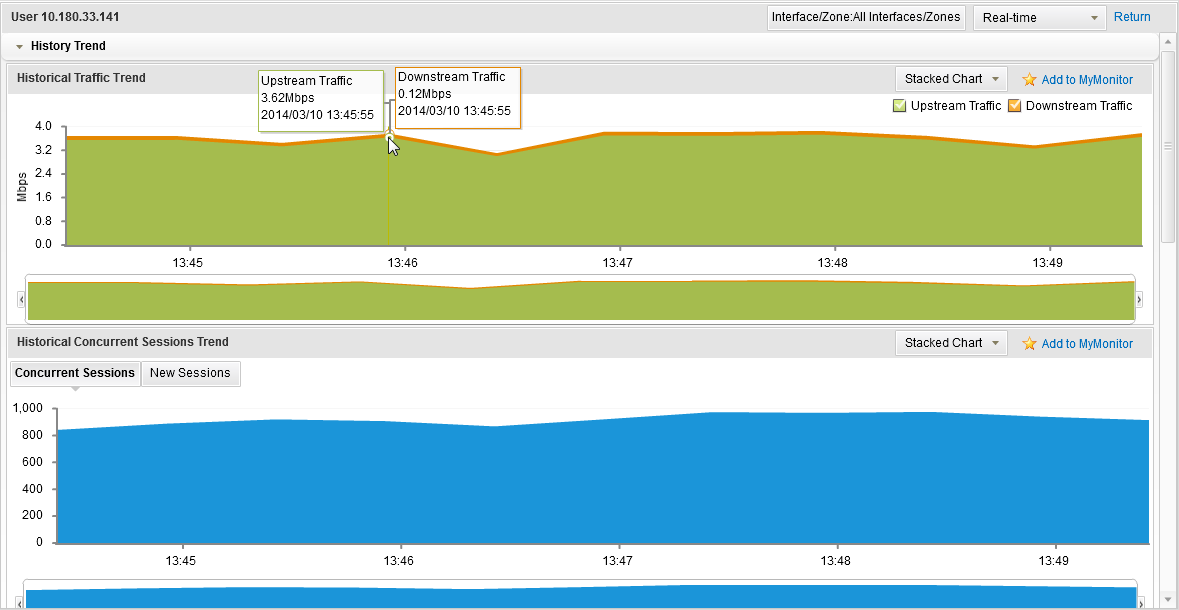
For example, in the User Traffic tab, hover your mouse over the bar of 10.180.33.141and then select Details from the pop-up menu. The detailed information of this user appears. The line chart and the stacked chart display the statistics of the history of user traffic, concurrent sessions, new sessions; the pie chart and the bar chart display the statistics of application traffic, application concurrent sessions, and application new sessions; the Session Table displays the session statistics of the selected users. Click the Return button to return to the User Traffic tab.
In the Application section, hover your mouse over the PING bar. A pop-up menu appears.
- To view all policies and session limit rules that are related to PING, click Policy or Session Limit. A new page appears to display the corresponding information. You can also perform the further configurations in the newly pop-up window. For detailed information, view Security Policy and Session Limit.
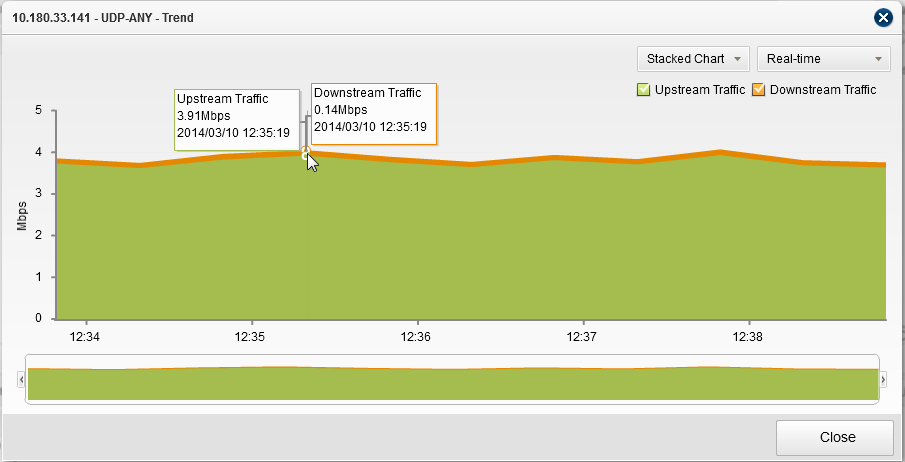
- To view the traffic history trend of this application, click History Trend. The 10.180.33.141 - PING - Trend window appears for your viewing.
Trends Comparison
Hover your mouse over the bar or the pie and then click Add to Comparison in the pop-up menu. The statistical object is added to the Comparison List. In the Comparison List, click Compare. A new window appears and displays the comparison results. For example, to compare the user traffic trend, take the following steps:
- With the User Traffic tab active, hover your mouse over the pie or the bar and then click Add to Comparison in the pop-up menu. The statistical object is added to the Comparison List.
- Repeat to add more objects for comparison. To delete the added object, click Delete in the Comparison List.
- Click Compare. The Trends Comparison window appears. The system will use legends with different colors to distinguish the statistical objects from each other.
- In order not to display the trend of certain statistical objects, uncheck the checkboxes next to the object names. To delete the selected statistical object from the comparison list, click the
 icon next to the comparison item. You can also click More Users to search users by specifying the username or IP address, add users, and delete users.


