Network Threat Monitor
Monitor > Network Threat
The Network Threat page displays the attack statistic information within the specified period.
Viewing Threat Monitoring Results
To view the threat monitoring results, take the following steps:
- To view the overview of the threat monitoring results, click the Summary tab. With the Summary tab active, you can view the following information:
- TOP 5 Attacks: Displays the attack details of the Top 5 devices the sources are targeting at within the specified period. When the mouse hovers over the histogram, it will show the attack times and source IP of the device.
- TOP 5 Victims: Displays the attack details of the Top 5 devices the destinations are targeting at within the specified period. When the mouse hovers over the histogram, it will show the attack times and destination IP of the device.
- TOP 5 Network Layer Attacks: Displays the attack details of the Top 5 attack name of Network Layer Attacks within the specified period. When the mouse hovers over the histogram, it will show the attack times and name from the network layer.
- TOP 5 Application Layer Attacks: Displays the attack details of the Top 5 attack name of Application Layer Attacks within the specified period. When the mouse hovers over the histogram, it will show the attack times and name from the application layer.
- TOP 5 Web Attacks: Displays the attack details of the Top 5 attack name of Web Attacks within the specified period. When the mouse hovers over the histogram, it will show the attack times and name from the web.
- TOP 5 Trojan Attacks: Displays the attack details of the Top 5 attack name of Trojan Attacks within the specified period. When the mouse hovers over the histogram, it will show the attack times and name of the Trojan attacks.
- TOP 5 Malicious Website Attacks: Displays the attack details of the Top 5 attack name of Malicious Website Attacks within the specified period. When the mouse hovers over the histogram, it will show the attack times and name from the malicious website.
- TOP 5 Malware Attacks: Displays the attack details of the Top 5 attack name of Malicious Website Attacks within the specified period. When the mouse hovers over the histogram, it will show the attack times and name from the malicious website.
- TOP 5 ARP Attacks: Displays the attack details of the Top 5 attack name of ARP Attacks within the specified period. When the mouse hovers over the histogram, it will show the attack times and MAC address of the device attacked from ARP.
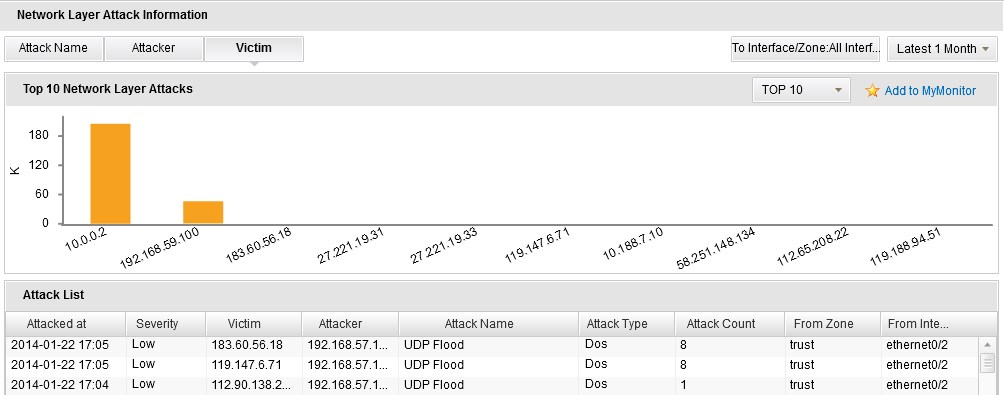
- To view the network layer attack statistics, click Network Layer Attacks tab or click the Details link in the Network Layer Attacks table in the Summary tab. In this page, click Attack Name to show the top 10/20/30 attack names of the network layer attack; click Attacker to show the top 10/20/30 devices the sources are targeting at; click Victim to show top 10/20/30 devices the destinations are targeting at. You can also select an interface/zone from the From Interface/Zone drop-down list to show the attack ranking information in the specified interface/zone.
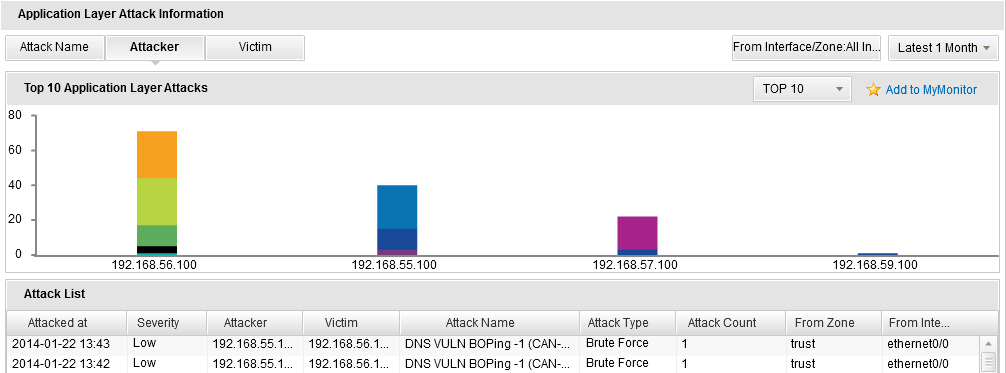
- To view the application layer attack statistics, click Application Layer Attacks tab or click the Details link in the Application Layer Attacks table in the Summary tab. In this page, click Attack Name to show the top 10/20/30 attack names of the application layer attack; click Attacker to show the top 10/20/30 devices the sources are targeting at from the application layer attack; click Victim to show top 10/20/30 devices the destinations are targeting at from the application layer attack. You can also select an interface/zone from the From Interface/Zone drop-down list to show the attack ranking information in the specified interface/zone.
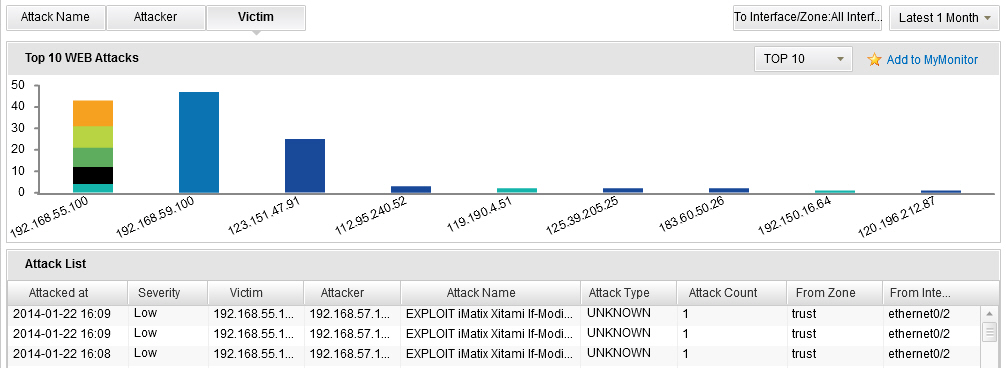
- To view the web attack statistics, click Web Attacks tab or click the Details link in the Web Attacks table in the Summary tab. In this page, click Attack Name to show the top 10/20/30 attack names of the web attack; click Attacker to show the top 10/20/30 devices the sources are targeting at from the web attack; click Victim to show top 10/20/30 devices the destinations are targeting at from the web attack. You can also select an interface/zone from the From Interface/Zone drop-down list to show the attack ranking information in the specified interface/zone.
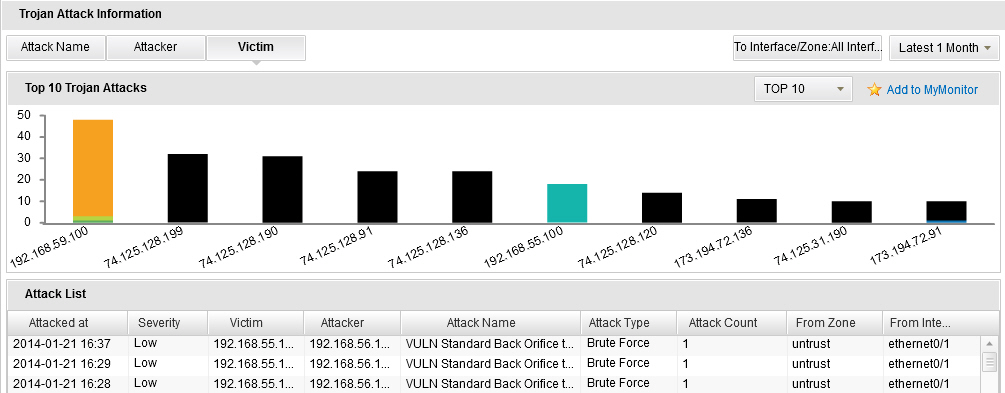
- To view the Trojan attack statistics, click Trojan tab or click the Details link in the Trojan Attacks table in the Summary tab. In this page, click Attack Name to show the top 10/20/30 attack names of the Trojan attack; click Attacker to show the top 10/20/30 devices the sources are targeting at from the Trojan attack; click Victim to show top 10/20/30 devices the destinations are targeting at from the Trojan attack. You can also select an interface/zone from the From Interface/Zone drop-down list to show the attack ranking information in the specified interface/zone.
- To view the malicious website statistics, click Malicious Website tab or click the Details link in the Malicious Website table in the Summary tab. In this page, click Attack Name to show the top 10/20/30 malicious website names; click Attacker to show the top 10/20/30 devices that visiting the malicious websites; click Victim to show top 10/20/30 devices that suffering from the malicious websites attacks. You can also select an interface/zone from the From Interface/Zone drop-down list to show the attack ranking information in the specified interface/zone.
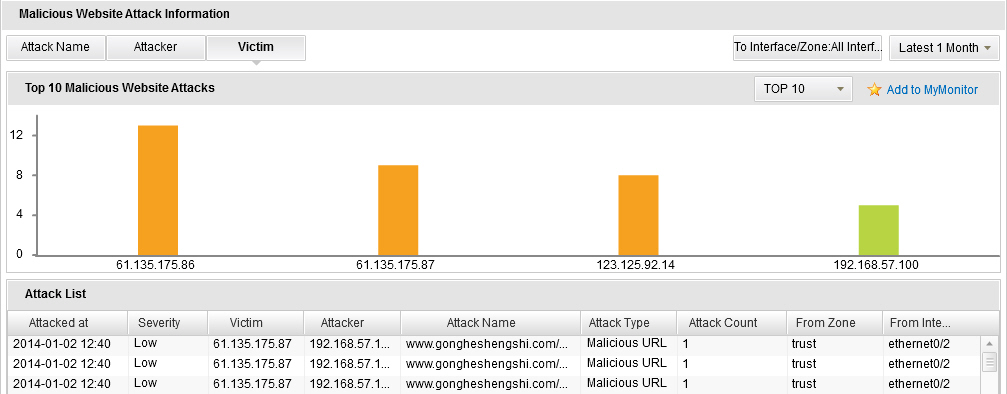
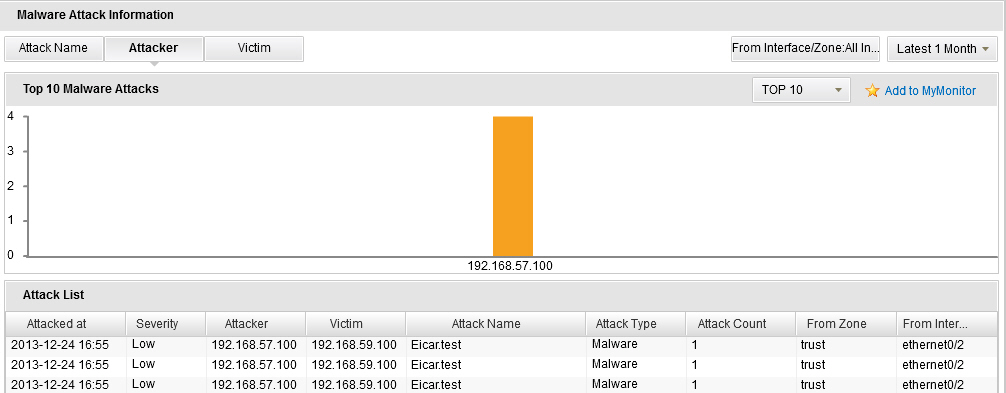
- To view the malware software statistics, click Malware tab or click the Details link in the Malware Attacks table in the Summary tab. In this page, click Attack Name to show the top 10/20/30 malware software names; click Attacker to show the top 10/20/30 devices that downloading the malware softwares; click Victim to show top 10/20/30 devices that suffering from the malware softwares attacks. You can also select an interface/zone from the From Interface/Zone drop-down list to show the attack ranking information in the specified interface/zone.
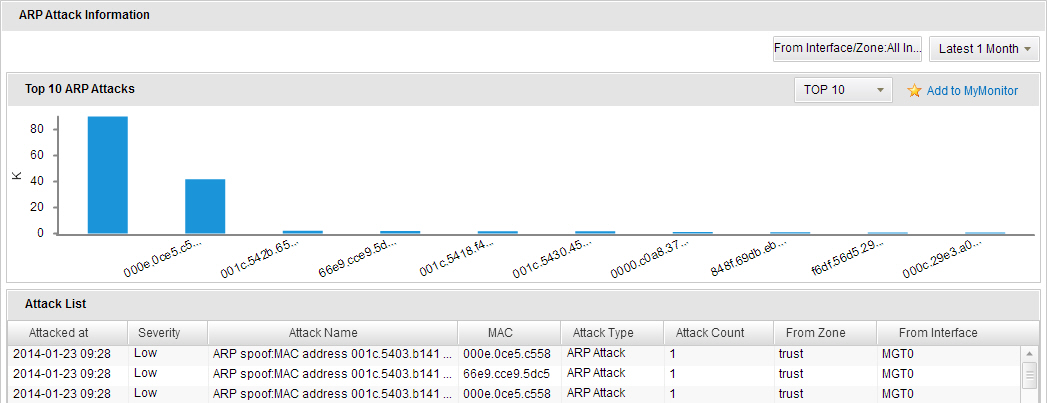
- To view the ARP attack statistics, click ARP tab or click the Details link in the ARP Attacks table in the Summary tab. The page shows top 10/20/30 device MAC addresses that suffering from the ARP attacks. You can also select an interface/zone from the From Interface/Zone drop-down list to show the attack ranking information in the specified interface/zone.
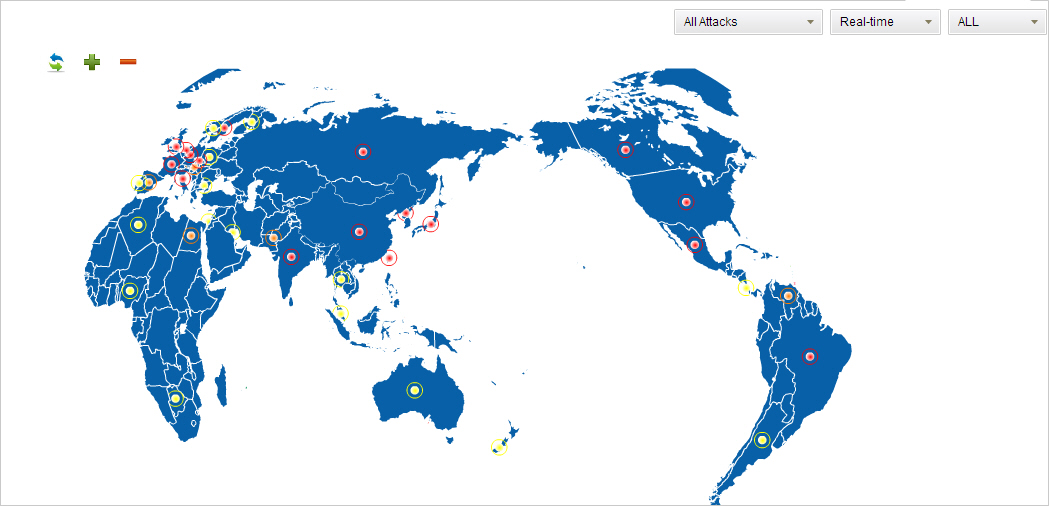
- To view the threat map, click Threat Map tab. You can judge the attack areas based on attack source IP, so that the geographical distribution of the attack suffered in the global map is displayed. According to the threat severity the area suffering, the red flashing dot indicates a high level of threats, orange indicates a medium level, and yellow indicates a low level.
Tips: In most pages in Monitor, you can perform the following actions:
- Select different statistical period to view the statistical information in different period of time.
- Click the Add to MyMonitor link to save the chart information in the current page to MyMonitor, which facilitates the quick viewing of these charts.
Statistical Period
The system supports the predefined time cycle and the custom time cycle. Click Latest 1 Hour ( )on the top right corner of each tab to set the time cycle.
- Latest 1 Hour: Displays the statistical information within the latest 1 hour.
- Latest 1 Day: Displays the statistical information within the latest 1 day.
- Latest 1 Week: Displays the statistical information within the latest 1 week.
- Latest 1 Month: Displays the statistical information within the latest 1 month.
- Customize: Customize the time cycle. Select Customize. The Select Time dialog appears. Select the start time and the end time according to your requirements.
Viewing Detailed Information
Hover your mouse over the bar chart of certain monitored objects and then select Details from the pop-up menu. Then the detailed information appears in a new page for your viewing. In addition, in the detailed information page, hover your mouse over the stacked or line that represents a certain object to view the statistics of history trend and other information.
For example, in the Trojan tab, hover your mouse over the bar of Microsoft IE NULL Byte CA SSL Certificate Validation Security Bypass and then select Details in the pop-up menu. The detailed information appears. The stacked chart and the line chart display the statistics of the attack times during different time. Click the Return button to return to the Trojan tab.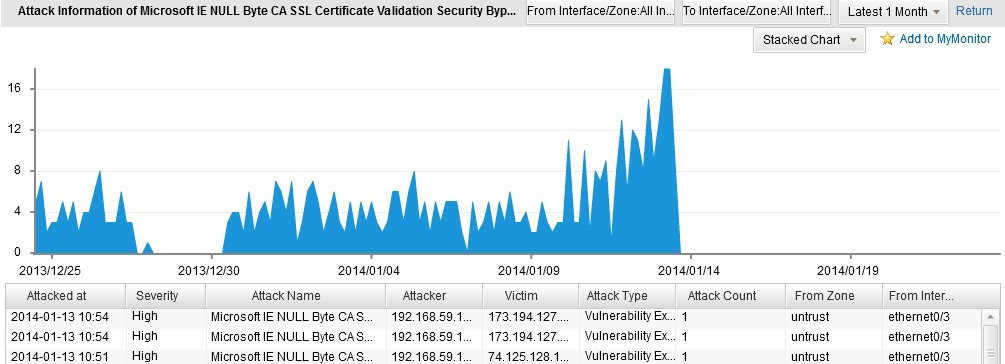


 )on the top right corner of each tab to set the time cycle.